Which jobs make money. How the bonus should actually be calculated. What's really happening across the operation. The answers are in your data, and your tools can't reach them.
You pull the same number twice and get two figures. Now nobody trusts either one.
The region is growing. The project is paying off. The program is working. You know it's true, and the data to show it is scattered across agencies, filings, and PDFs.
You can tell sales dipped. You just can't tell what caused it, or what to do next.
The numbers exist. They're just scattered, and often sitting where nobody thinks to look. More software won't fix that. Finding them and applying them will.
Some engagements are a full platform. Some are one hard problem. All of them get the same team and the same standard of work.
Your systems are only the start. Public records, agency files, exports, and PDFs: if the numbers exist, we track them down and bring them into the picture.
Dashboards shaped by how you actually run the organization, not a template. Ask a question in plain English, get an answer in seconds.
Deep-dive analyses and plain-English reads from our analysts: what is working, what is slipping, and what deserves your attention.
Migrations, integrations, and cleanup. Tools that never talked to each other, finally feeding one clean picture.
New reports and metrics as the organization grows, and ad-hoc requests anytime, so your team stops crunching numbers and starts acting on them.
Daily monitoring, fast fixes when a connection breaks, and continuous verification of every output. The report you open is right.
Five problems we see every week, and what they look like after we get involved.
Every month, someone loses three days assembling the same report by hand, and it still lands late.
Sales says one thing, accounting says another, and nobody trusts either. We bring every source into one picture, so the same question always gets one answer.
Hand-built spreadsheets carry small errors into big decisions. We automate the busywork and check every number on the way through.
The answer is in there somewhere, buried in ten thousand rows. We turn the pile into a picture you can read at a glance.
Decisions could not wait for the numbers, so leaders went with gut. Now the numbers are already on the screen when the question comes up.
Every engagement, whatever its size, is the same three moves, done for you. Then we keep it right.
Most clients don't arrive with a metric list. They arrive with a question, or with something they know is true and need to show. Working out what to measure is the first thing we bring.
Some of it sits in your systems. Some sits in public records, government offices, and PDFs spread across dozens of organizations. Gathering it into one place is work almost nobody has the time or the tools to do. We do.
Raw material becomes a tailored data platform: analyzed, visualized, and readable by the people who need it. Ask in plain English, get answers, decide with real figures.
Daily monitoring, continuous checks, fast fixes. What we build stays as reliable as the day it went live, and keeps answering as new questions come up.
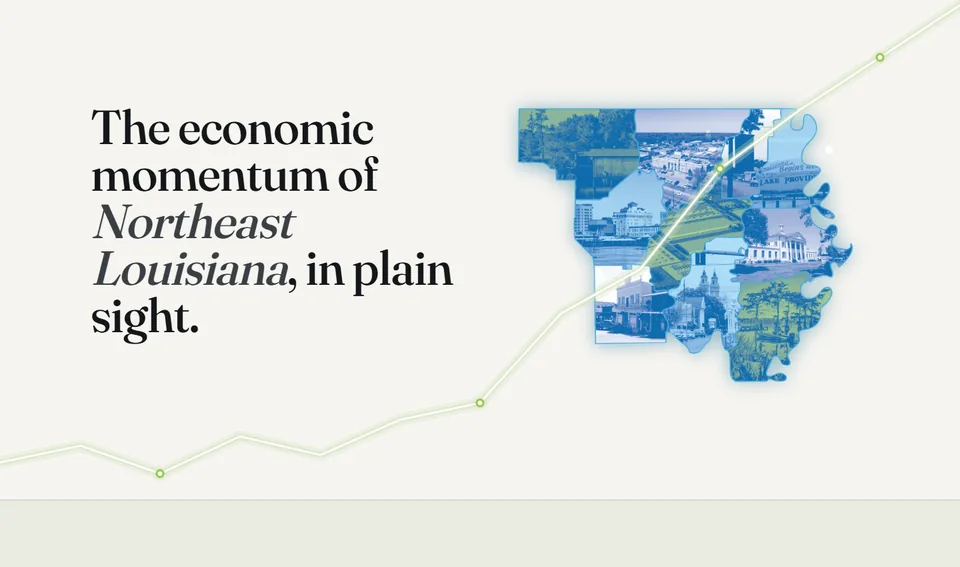
Some of the most important numbers never sit in anyone's system. A region growing. A project paying off. A program delivering on its mission. The proof is scattered across agencies, filings, and PDFs, and the audience is skeptical. That is claim-support work, and it is some of the work we do best.
The right metric is one people can feel. For a region's growth, that was sales tax: an early indicator everyone already understands.
Agencies, administrators, filings, PDFs. We do the hunting, the phone calls, and the back and forth, and bring it all into one place.
Analyzed, visualized, and public where it should be, so your audience can explore the numbers for themselves.
The strongest case is the one your audience can check for themselves.
Some organizations need one stubborn problem solved. Some need the whole picture built. Either way, it is the same team and the same standard.
A deep analysis, systems that need untangling, a migration, a report your team needs built right. If it is data work, bring it.
Your organization's numbers pulled into one trusted place, with dashboards built around how you actually run it. Live in about two months.
For organizations that want the numbers handled continuously: monitoring, analysis, and new reports as you grow, at one flat monthly price.
Every engagement is priced before we start: flat project prices, a one-time price for a platform buildout, and one flat monthly price for ongoing work. Straight numbers on the call, exact terms in writing, no surprises.
It depends on the scope. Small projects land in days or weeks. A full platform is about two months from kickoff, with your first numbers on a real dashboard within two weeks.
Because a tool was never the whole job. The definitions, the checking, the upkeep, the weekly reading: that work needs an owner, and with us it has one. You get answers, not another login.
If it holds your numbers, we can almost certainly connect it: accounting like QuickBooks, CRMs, job-costing, scheduling, billing, phone systems, even the spreadsheets. We confirm your exact list on the call.
For most engagements, a one-hour kickoff, a few short sessions to define your numbers, and a weekly 30-minute status call. We do the heavy lifting.
We take the least access we need, all connections are read-only, credentials stay your property and revocable at any time, and everything is documented up front.
You do. The platform, the definitions, and the documentation are your property, in your accounts. If we ever part ways, it all stays with you.
Whatever we build is documented and yours to run. And if you want it watched, kept right, and growing, that is what ongoing work is for.